Graphical Tiles in the Custom Display
Graphical tiles in the Custom Display show several pieces of information about the data object.
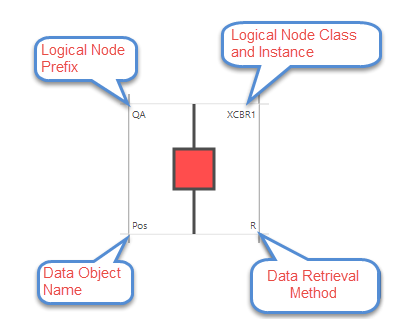
In the corners of each tile is information about what the data object represents:
- Logical Node Prefix - this is a custom name from the IED data model to identify what primary equipment (like switch gear or transformer) is represented by the logical node
- Logical Node Class and Instance Number - this comes from the IED model. The logical node class is defined by the IEC 61850 standard. The instance number is a unique number for this instance in the logical device of the IED. The two are combined into one label. For example, the first instance of XCBR is shown as XCBR1.
- Data Object Name - this is standardized by the IEC 61850 standard and indicates what type of data is contained. For example, Pos is a double point value that represents the status of a switch or breaker position.
- Data Retrieval Method - this indicates how the data is being retrieved from the IED. (G = GOOSE, R = Report, P=Polled, N/A = Not Accessible). The data retrieval method is set when the data object is added to the custom display.
In the example below, the position status for a breaker (XCBR.Pos) is shown and the data retrieval method is report. The graphics and text in the tiles are dynamic and change as the values in the server’s model change.
Additional Data
Additional data object information can be shown by allowing the mouse to pause over the tile. This will display a tool tip with more detailed information including time stamp and quality.

Additional Options
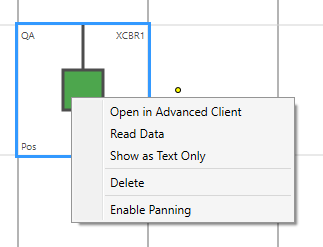
Right clicking on a tile will access the context menu. The context menu will differ depending on the type of tile that is selected. The context menu will also be different if multiple tiles are selected.
- Advanced Client - will open the Advanced Client tool and navigate directly to the data object in the IED data model
- Read Data - . will cause Test Suite Pro to immediately poll the server for the DO values. The poll will occur even if the data retrieval mode is set to Report or GOOSE. Note that the values will be immediately overwritten when the next report or GOOSE is received.
- Show as Text Only - will display the data object values as text
- Delete - will remove the tile from the custom display
- Enable Panning - will turn on panning mode to move the display with the mouse
- Show event log - will show an event log. This is available for some tile types.
Send Controls
If the data object is controllable, using the Advanced Client is how to affect the control. However, he CSWI Logical Node can be directly controlled through a graphics tile.
Palette
In addition to adding tiles from the Data Miner, tiles can be added from the Palette which is located on the right side of the Custom Display grid. These tiles are passive and are available to create single line diagrams to help put data object tiles into context. The palette objects consist of various bus bar lines and connecting lines. There are also palette objects that represent a transformer, a load, and a ground connection. A label object is also available on the palette which can be used to annotate the diagram. All the palette objects are rotatable.
By dragging data objects and palette objects to the Custom Display, a representation of a single line can be quickly created.

Tile Types
The design of a tile on the Custom Display is based on the Common Data Class (CDC) of the data object that is dropped onto the Custom Display grid. In general, if a data object contains a status value (stVal) or a measured value, then that value will be shown. If a data object contains sub CDC objects, then the status or measured values of each sub CDC is displayed in the tile.
Single Point Status and Control
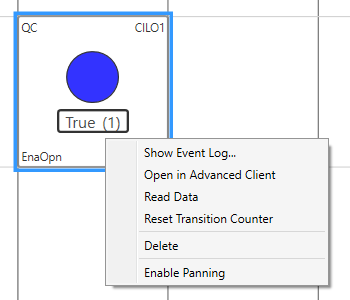
This tile is for data objects that use the SPS or SPC Common Data Classes. Below is an example of the EnaOpn (enable open) data object in a CILO logical node.
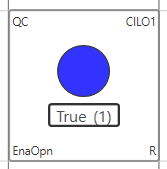
This tile shows the value of the stVal along with a graphical element that represents the value. The blue circle is present if the value is true. An empty (white) circle is displayed if the value is false.
This tile has an event log built in to view a sequence of events. Next to the value is an event counter. This counter is incremented each time the status value changes. Right clicking on the tile gives two options for the event log:
- Show Event Log - this will show the event log in a separate window
- Reset Transition Counter - this will reset the event counter but not the event log
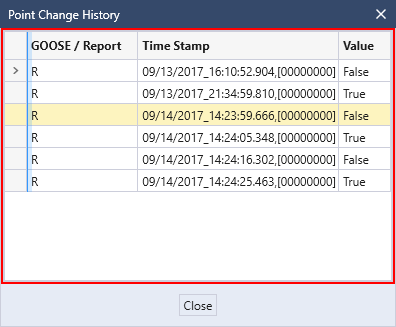
By selecting the Show Event Log… menu option, a history of the status change events can be displayed. The Event Log holds a record of the last 100 status changes. The log is not reset if the counter on the tile is reset. Below is an example of an event log that had five transitions. Each transition row shows the timestamp, quality bits, and value. Note that only transitions that occurred as a result of GOOSE or report messages are included in the event log. If the tile is set to data retrieval method of polled, the event log will not be available.
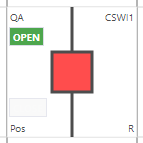
Double Point Status and Control
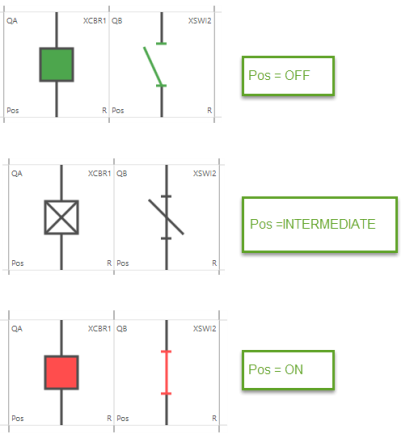
This tile shows double point objects which use the Common Data Class of DPC which can be in the logical nodes XCBR, XSWI, or CSWI. These are represented in the custom display either as a breaker or switch.
Note: the colors assigned to single and double point data attributes can be customized on the Application Options dialog box. Below are the default color settings for double point objects.
Protection Activation Information and Directional Protection Activation Information
The ACT and ACD Common Data Classes are examples of CDCs use for protection events. ACT contains a sub-data objects for General trip information and may contain trip information for phases A, B, and C as well as Neutral and Residual. The same is true for ACD which also contains directional information for each s sub-data object.
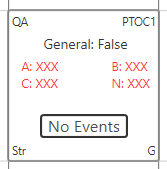
Below is an ACT Common Data Class example for PTOC (time over current).
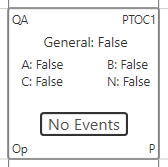
Note that the data retrieval method is polling (“P” in the bottom right corner). This data object was not available through reports or GOOSE. The tile contains an event counter that is incremented each time the General value goes from False to True. The counter value will be shown in place of the text that currently reads “No Events”, after the first event occurs.
A history of trip values for each phase can be seen by selecting the Show Event Log... menu option from the context menu. The context menu also contains an option called Reset Trip Counter that will reset the counter value to “No Events”.
The trip status for each phase is displayed under the General trip status. Values for the phases are only displayed for phases that are contained in the model.
The tile for a data object based on an ACD is similar to one based on an ACT. The difference is in the values displayed for the General and phase trip statuses. If a trip status is False, then False will be displayed (like the ACT), but if the trip status is True, then the corresponding Direction value is displayed if it is available. If it is not available, then the value True is displayed. For example, if phsA is True and dirPhsA is Forward, then the text on the tile will be “A:Forward”. If a value for dirPhsA is not available, then the text on the tile would be “A:True”. A value might not be available because it is not in the model or it may not be part of the data set that is used in a GOOSE or report message.
The example below shows a PTOC Start data object which is based on an ACD. The General trip status is in a GOOSE message but the phase trip statuses are not part of the data set. In this case, the tile shows the phases, but their values are shown in red with the text “XXX” to indicate these values are not available through GOOSE.
The values of the individual phases can be read using the Read Data context menu option, but the values will return to “XXX” the next time a GOOSE message is received.
Phase to Ground, Phase to Phase, and Sequence Measurement Objects
Data objects that are based on WYE, DEL, and SEQ Common Data Classes will be displayed in a format similar to the one shown below. The units and multiplier values will be displayed as they are found in the model. If values are being retrieved through GOOSE or reports and the associated data set does not contain unit or multiplier attributes, then Test Suite Pro will read those values from the server when the data object is dropped on the grid.
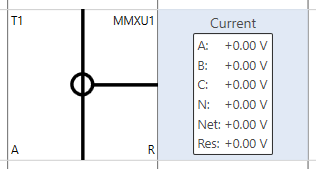
There are two special cases where data objects of type WYE have different tile designs. These special tiles represent current and voltage transformers in single line diagrams.
Below is an example of a data object A which uses the WYE Common Data Class.
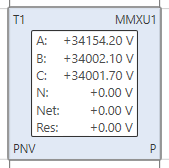
Below is an example of a data object PhV which uses the WYE Common Data Class.